

Weekly Market Analysis 06/08/2025
EURUSD
🔹 4H Structure – Uptrend & Support Flip
-
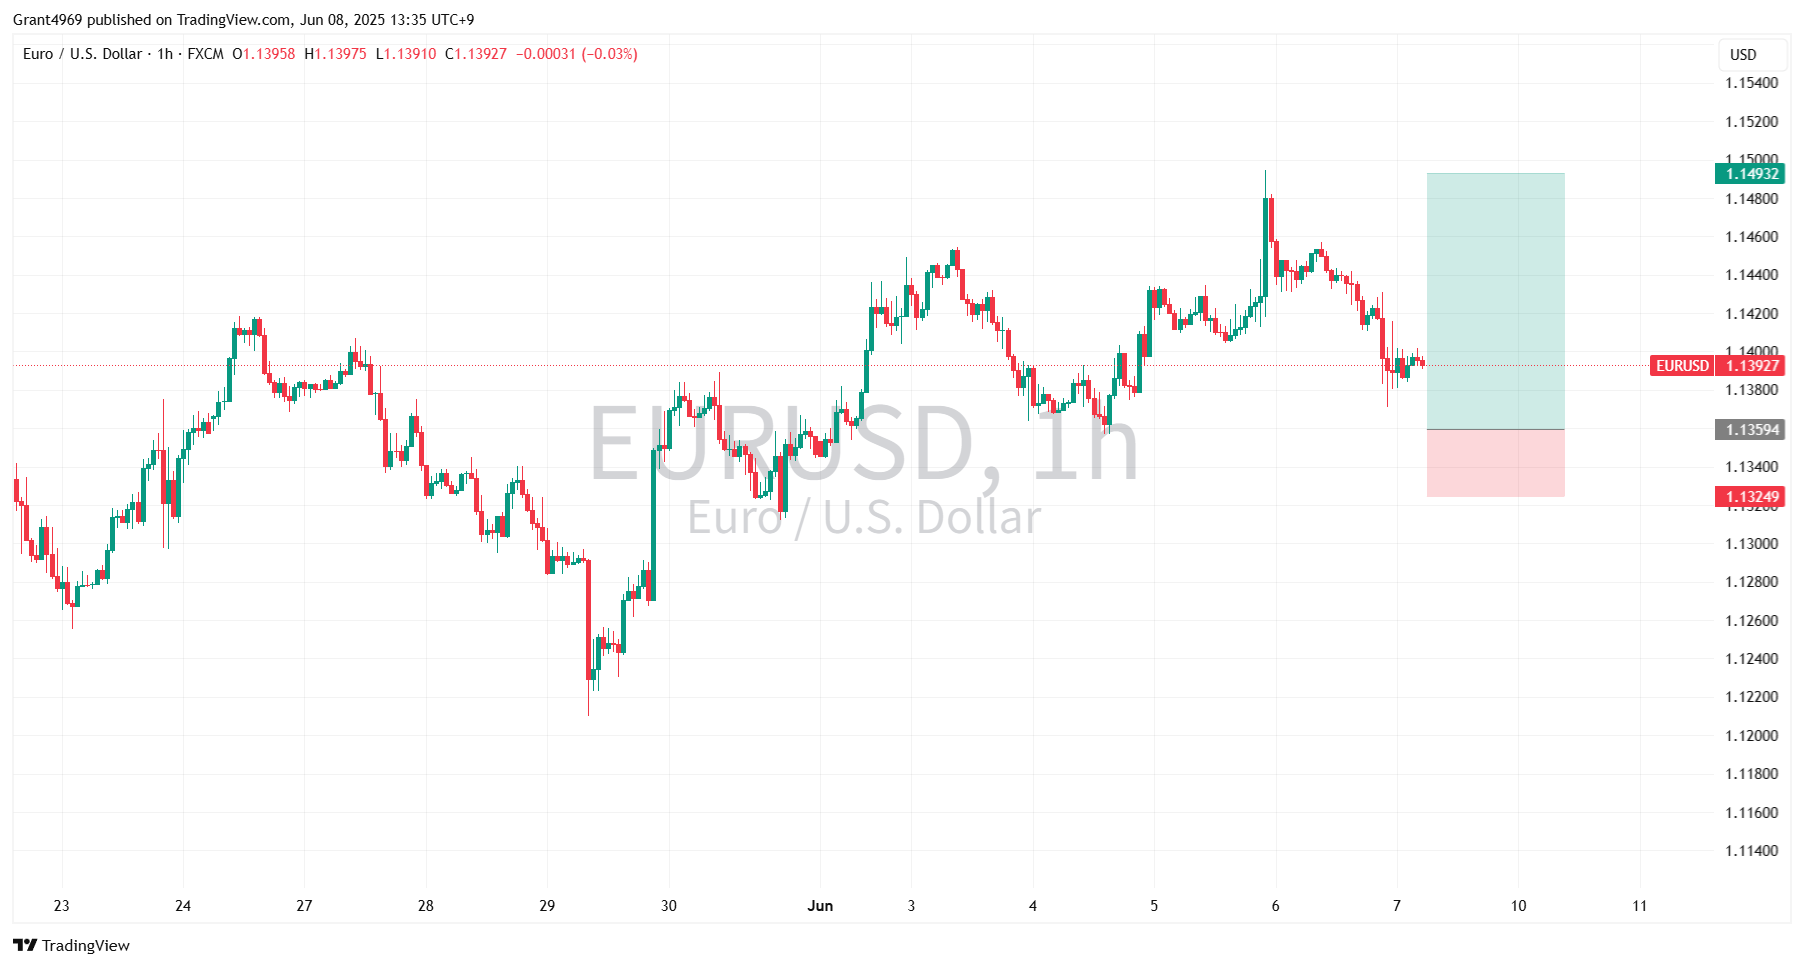
EUR USD has been making higher highs and lows since early June.
-
The 1.1360 zone acted as swing-high resistance on June 3–4, then broke higher on June 5. Price is now retracing to test it as support 🔄.
🔹 1H Price Action – Retest Rejection
-
On the 1-hour chart, the 1.1360 area saw a small bullish engulfing after the break, followed by a pin-bar test—clear rejection of sellers below.
🔹 15M Micro-Setup – Bull Flag Entry
-
After the break, price pulled back into a tight 3-bar bull-flag on 15 min, with the flag’s lower trendline sitting right at 1.1360.
-
Two candles printed long lower wicks into that line, ideal for a limit-buy entry 📈.
▶️ Trade Details:
-
Entry: Buy limit @ 1.13594
-
Stop Loss: 1.13249 (below the 15 min swing low) 🔴
-
Take Profit: 1.14932 (just under the June 5 high) ✅
-
R:R: ~1 : 3.8 ⚖️
USDJPY
🔹 4H Structure – Uptrend & Support Flip
-
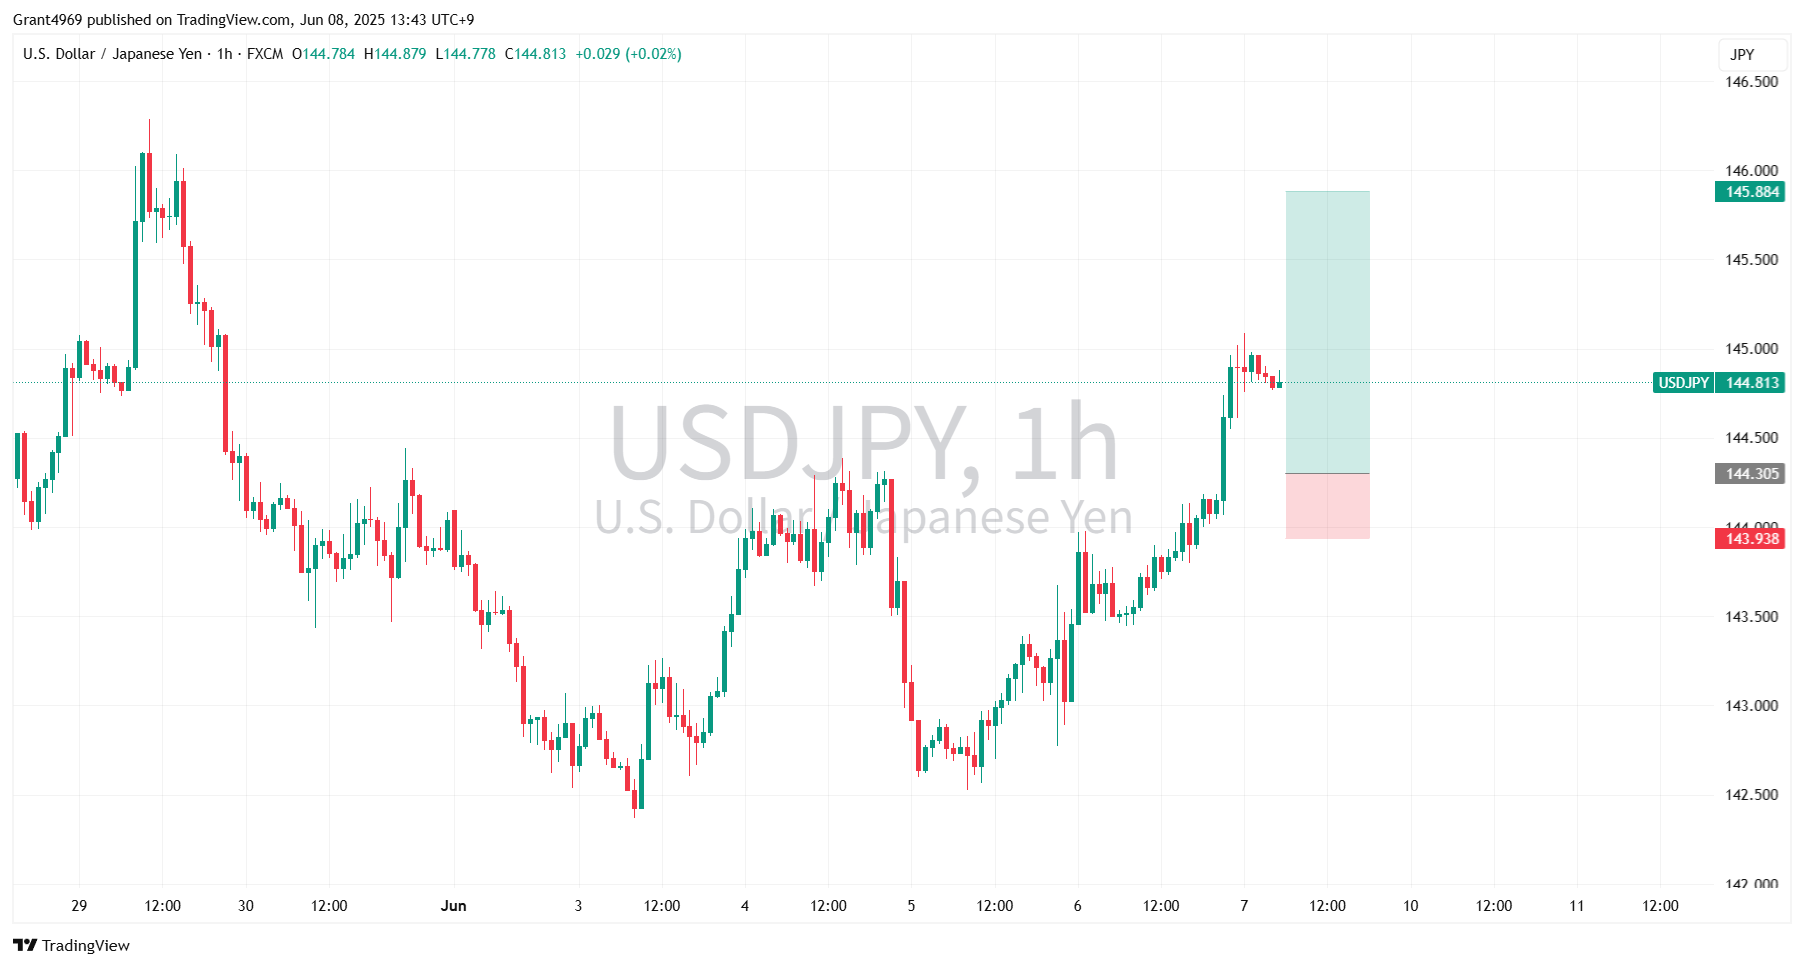
USD JPY has been tracing higher highs/lows since late May.
-
The 144.30 area was a swing-high resistance on June 4–5; price cleared above on June 6 and has now retraced to test it as new support.
🔹 1H Price Action – Retest & Rejection
-
On the 1-hour chart, that 144.30 zone held a small pin-bar and an inside-bar after the break, signaling buyer conviction at the flip 🔄.
-
The lower shadow on the test candle shows clear rejection of offers below.
▶️ Trade Details:
-
Entry: Buy limit @ 144.305
-
Stop Loss: 143.938 (below the 15 min swing low) 🔴
-
Take Profit: 145.884 (just below the June 6 high) ✅
-
R:R: ~1 : 4.3 ⚖️
USDJPY
🔹 4H Structure – Uptrend & Support Flip
-
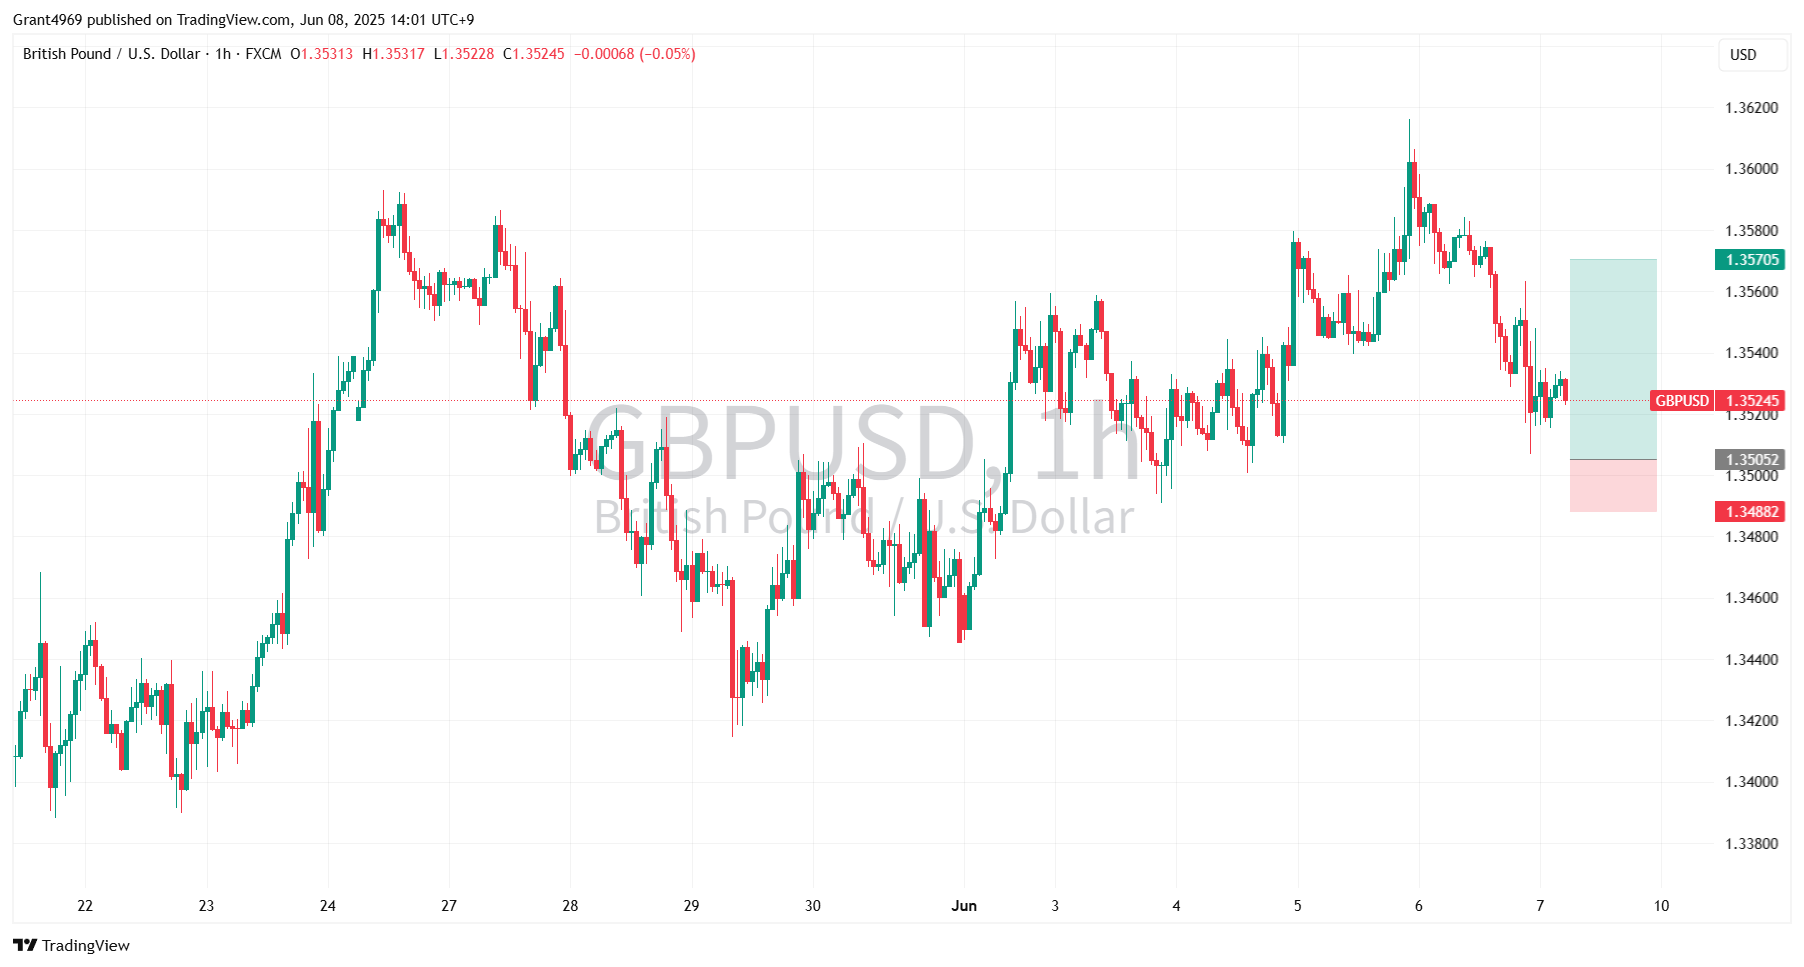
Since mid-May, GBP USD has been making higher highs and lows, in a clear uptrend.
-
The 1.3505 zone acted as swing-high resistance on May 30–31, was breached on June 1, then flipped to support and held on the June 7 retest (4H hammer) 🔄.
🔹 1H Price Action – Pin-Bar Rejection
-
On the 1-hour chart, the test candle printed a long lower wick down to 1.3505 and closed above its midpoint, rejecting sellers below.
▶️ Trade Details:
-
Entry: Buy limit @ 1.35052
-
Stop Loss: 1.34882 (below the 15 min swing low) 🔴
-
Take Profit: 1.35705 (just under the recent 4H high) ✅
-
R:R: ≈ 1 : 3.8 ⚖️
XAUUSD
🔹 4H Structure – Downtrend & Resistance Flip
-
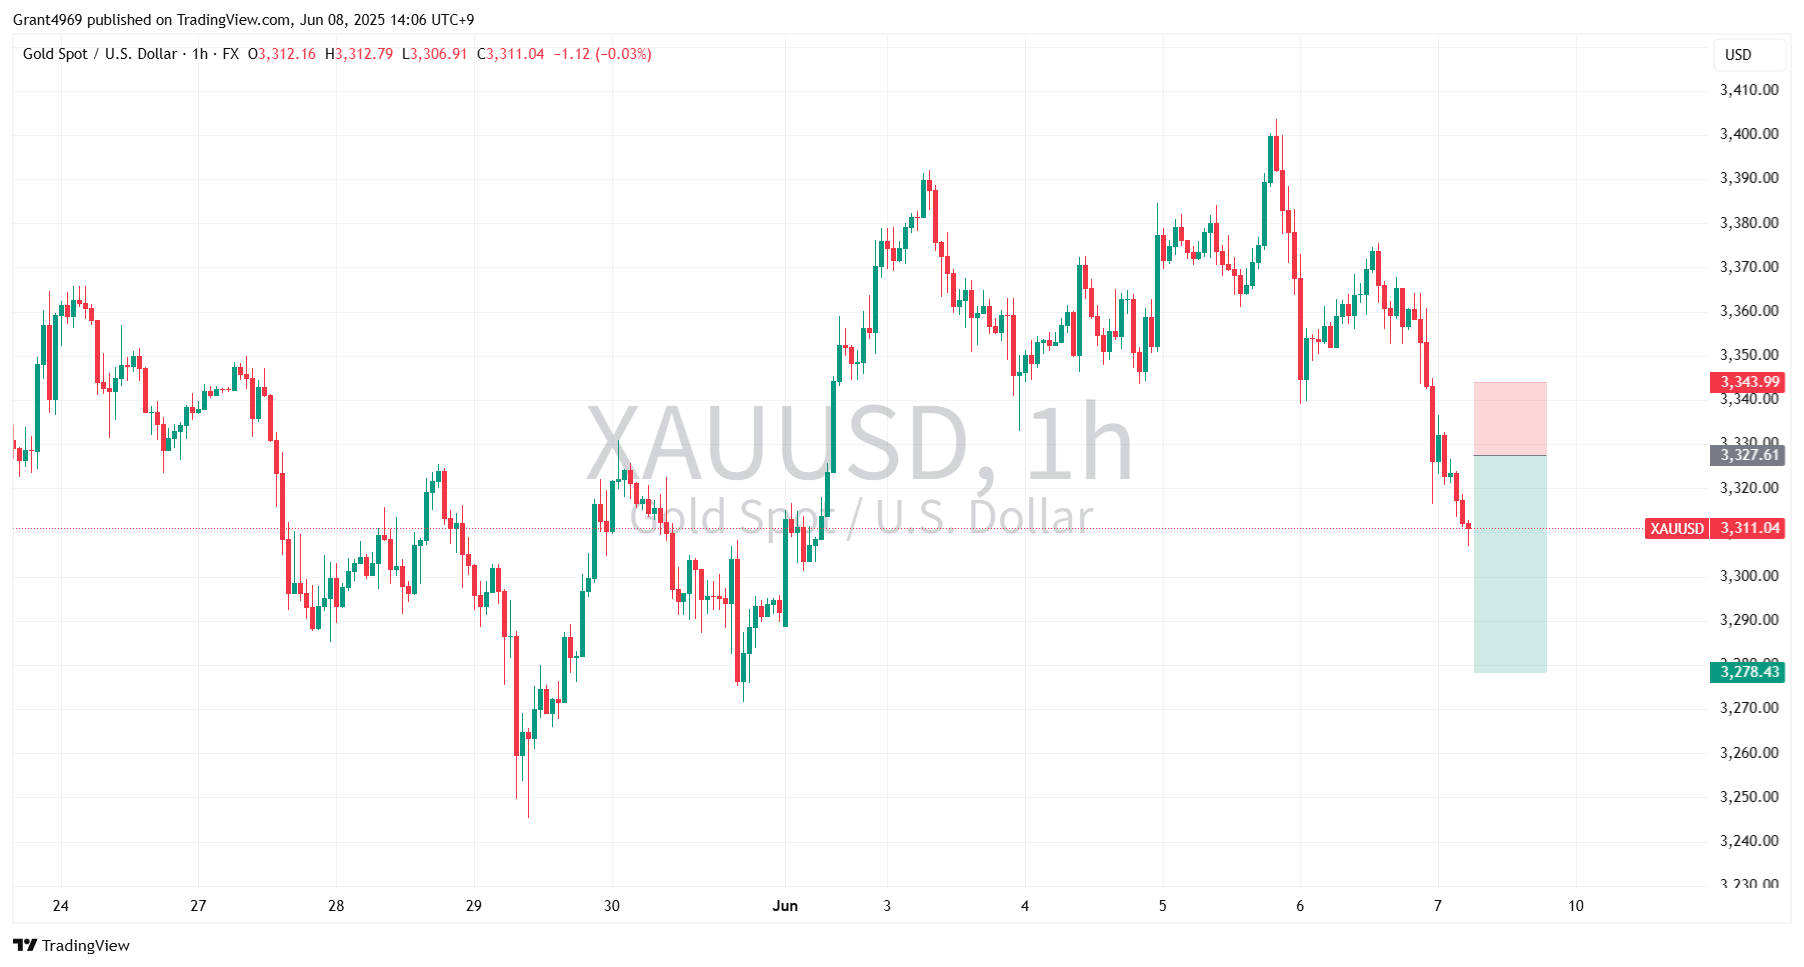
XAUUSD has been tracing lower highs/lower lows on the 4-hour since the May 15 high around 3,423.
-
The 3,327.6 area acted as 4H support on June 5 and held a bounce; on June 7–8 price retested and failed above, flipping it into resistance 🔄.
🔹 1H Price Action – Rejection
-
On the 1-hour chart, price rallied back up to 3,327.6, printed a bearish pin-bar (long upper wick) and closed lower—clear rejection of higher levels.
▶️ Trade Details:
-
Entry: Sell limit @ 3,327.61
-
Stop Loss: 3,343.99 (just above the 15 min swing high) 🔴
-
Take Profit: 3,278.43 (near the June 7 4H low) ✅
-
R:R: ~1 : 3 ⚖️
BTCUSD
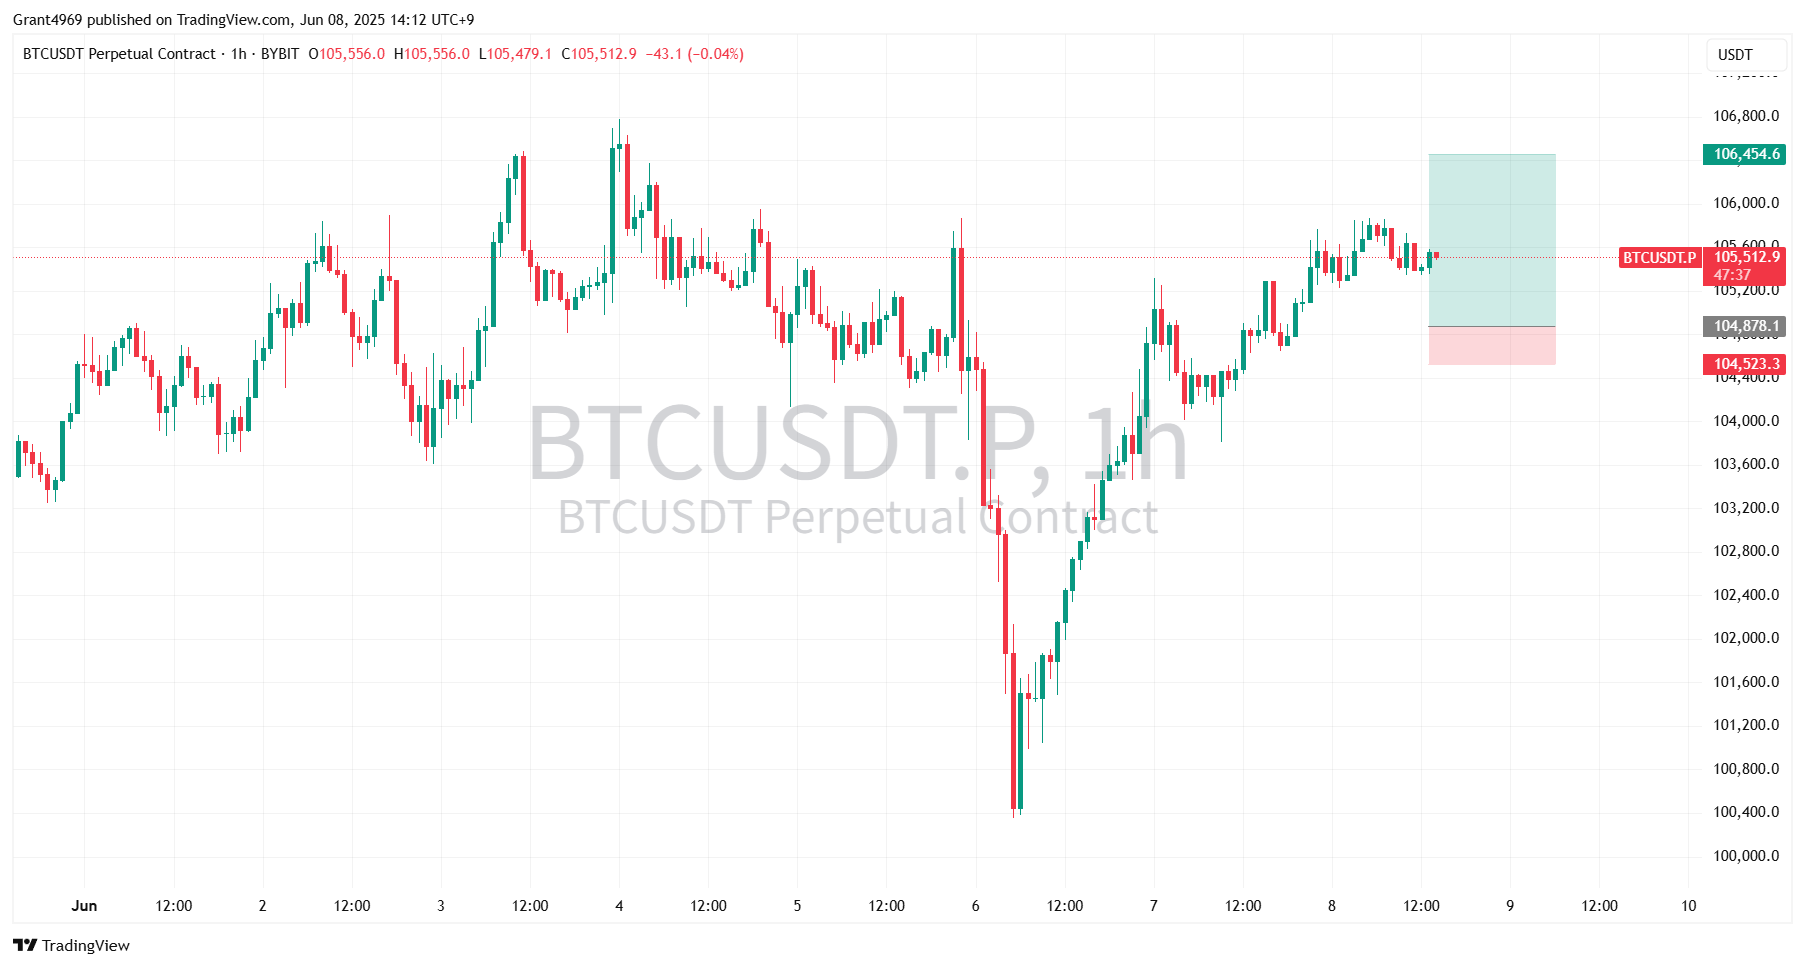
4H Structure – Reversal & Support Flip
-
BTCUSDT fell from ~112 k down to ~100 k on June 6, then bounced back toward 106 k.
-
The 104 878 level was the June 6 4-hour swing low and has now flipped into support 🔄.
🔹 1H Price Action – Retest Pin-Bar
-
On the 1-hour chart, price pulled back into 104 878 and printed a bullish pin-bar (long lower wick), rejecting lower prices.
🔹 15M Micro-Setup – Lower-Wick Rejections
-
On 15 min, two candles around 104 878 showed long lower shadows—micro confirmation of buyers stepping in.
▶️ Trade Details:
-
Entry: Buy limit @ 104 878.1
-
Stop Loss: 104 523.3 (below the 15 min swing low) 🔴
-
Take Profit: 106 454.6 (just under the June 8 high) ✅
-
R:R: ~1 : 4.4 ⚖️


Inbox Insights
Subscribe for weekly market updates, expert strategies, and in-depth analysis.