
Investment Conclusions and Overall Framework
- Core Proposition
Over the next three to five years, the core logic for gold comes from the “decline of the dollar-dominated old order.” Central banks and sovereign institutions, as well as long-term investors, need to continue to allocate counter-assets to the multi-dimensional risks of the dollar and dollar-denominated debt. In this process, gold is regarded as an external anchor to the dollar order and the most critical “sanction risk and credit risk insurance.”
From this perspective:
• The first layer of drivers is the risk reassessment of the dollar order itself, including asset freezes, geopolitical conflicts, erosion of trust among allies, unsustainable U.S. finances, and chaotic domestic turmoil.
• The second layer of drivers is the reserve reallocation behavior of central banks and sovereign institutions, with central bank gold purchases forming a structural demand across cycles.
• The third layer is institutional and individual investment demand guided by real interest rates, ETF fund flows, etc., which mainly plays a role in adjusting the premium/discount and wave patterns of gold prices in the price rise channel.
• The supply side has limited short-term response, while in the long term, it provides medium- to long-term marginal support through “mineral production tending to plateau, grade, and cost pressures.”
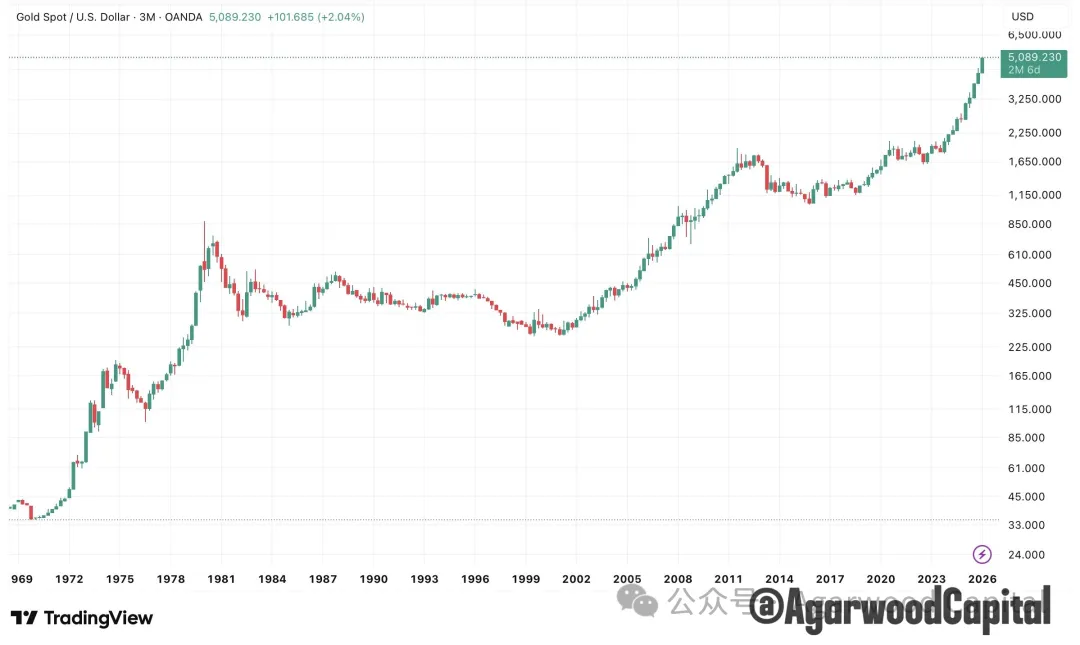
Figure 1: Quarterly Gold Price Chart (Logarithmic Scale)
Source: TradingView, Agarwood Capital
- Directional Judgment of Price Path
With the combination of continuous central bank purchases, unresolved risks in the dollar order, and limited supply-side growth, gold is likely to remain in a channel of constantly rising bottoms and continuous historical highs over the next three to five years. In the benchmark scenario, we believe the price can rise above $10,000. If more severe geopolitical, monetary, and order shocks occur, the probability of testing the $15,000-20,000 range needs to be included in scenario planning.
- Reassessment of the Role of Interest Rates
Empirically, gold and the U.S. ten-year real interest rate still have a long-term negative correlation. However, experience since 2022 shows that even if real interest rates are at a relatively high level, gold can still reach historical highs in the stage where central banks become the main buyers. Interest rates and interest rate expectations are now closer to “determining whether the private sector is willing to add leverage on top of central bank support” and no longer solely determine the long-term direction of gold.
Old Order Cracking: From Sanctions to Trust Erosion
This chapter focuses on “why the market should reassess the dollar and dollar assets themselves,” which is the macro starting point for gold to become a counterparty to the dollar.
2.1 Russia-Ukraine War and Asset Freezes: Sanction Risks are Repriced
• After 2022, the West imposed large-scale financial sanctions and reserve freezes on Russia, and approximately $2,800 to $3,000 million of Russian sovereign assets were locked, mostly in European clearing institutions. This directly impacted the belief in “official reserve safety.”
• Since 2022, there has been a high degree of temporal correlation between increased central bank gold purchases, Russia-related sanctions, and increased gold reserves as a percentage of reserves in emerging market central banks, as shown in Figure 2. Poland, Turkey, India, and China (it is generally expected that China’s gold reserves far exceed official data) are the main gold buyers.
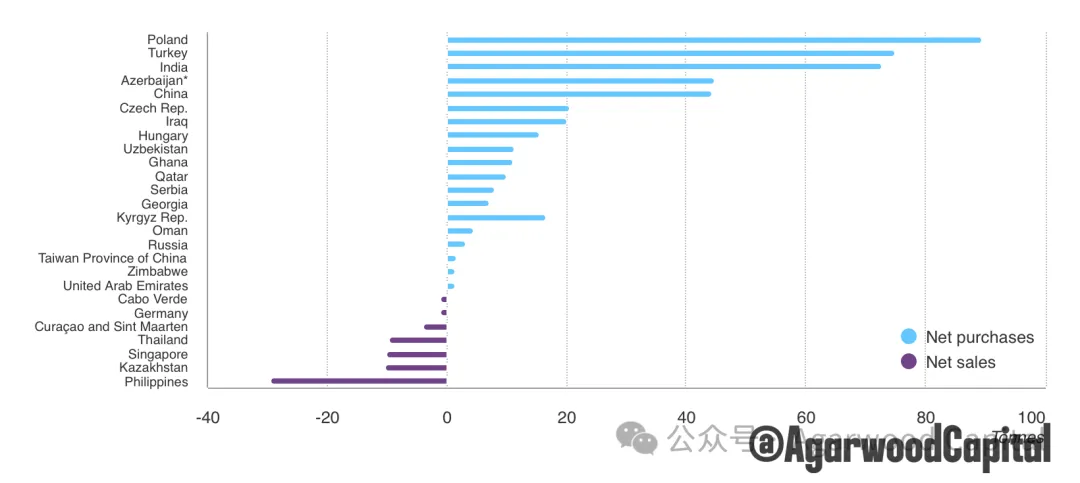
Figure 2: Net Gold Purchases (Sales) by Country in 2024
Source: Bloomberg, ICE Benchmark Administration, World Gold Council
For any central bank holding a large amount of dollars or euro assets, reserve assets are no longer just about “yield and liquidity,” but must also prevent “jurisdictional and sanction tools.” The result is:
• Reserve portfolios are further shifting from “internal currency diversification” to “diversification from sovereign liabilities to non-credit assets.”
• Gold is the only tool under the existing system that combines historical credit, sufficient liquidity, and cross-jurisdictional portability.
2.2 Donald Trump’s ‘Trumpism’ New Route and Chaotic Domestic Affairs
• The policy style before and after Trump’s two terms has made it clear to allies and neutral countries that security, tariffs, market access, currency, and financial arrangements are often packaged as bargaining chips and are no longer always stably packaged as “part of a long-term order.”
• Multiple tariff increases and decreases, military spending negotiations, and pressure on NATO and East Asian allies, including territorial claims on Greenland, have substantially weakened the image of the “U.S. order as a public good” and increased doubts about the reliability of the United States. Canada and Europe have realized that they need to rely on themselves.
• Promoting ‘Trumpism,’ arresting the President of Venezuela, and military strikes against Iran (likely a second time) are fundamentally about might makes right, which increases the risk of geopolitical instability.
• Trump’s capricious and arbitrary governance model will inevitably lead to increasingly chaotic domestic politics, social division, and intensified conflicts, such as ICE recently shooting and killing its own citizens in the streets.
The market-level implications are:
• Even though the dollar still occupies a dominant position in payment and capital markets, the consensus that holding dollars and its bonds as the only ultimate safe asset is loosening.
• This trust discount is rarely immediately reflected in exchange rates but will slowly be reflected in reserve structure adjustments, such as increasing the proportion of gold and other physical assets, as shown in Figure 3. Foreign central bank gold reserves exceeded U.S. debt for the first time since 1996 in 2025.
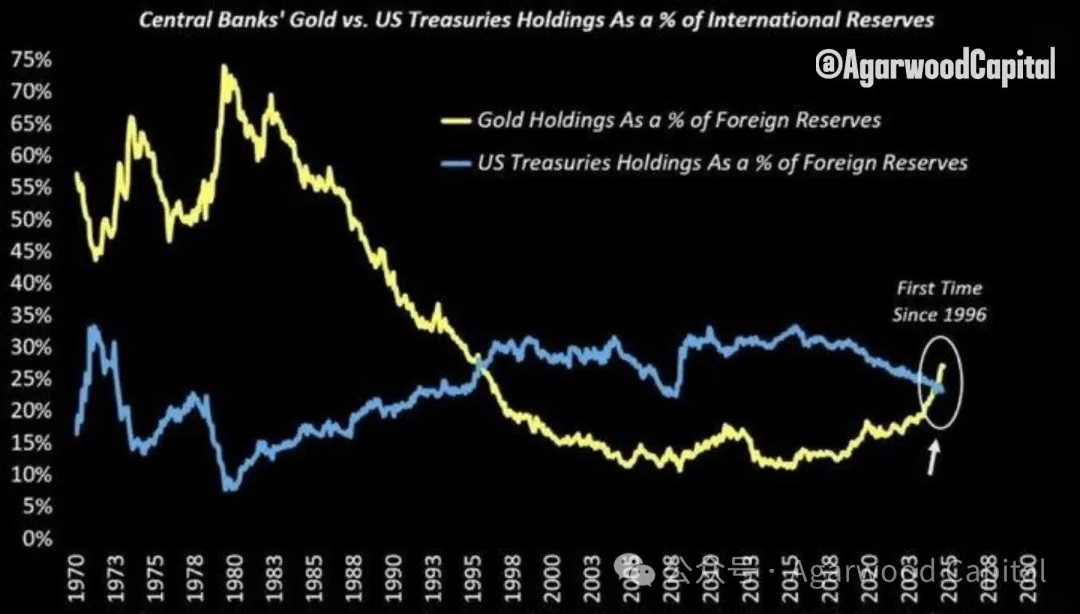
Figure 3: Foreign Central Bank Gold Reserves VS U.S. Debt
Source: Bloomberg
2.3 Unsustainable U.S. Finances and Long-Term Credit Discount
• The IMF, major institutions, and the U.S. CBO’s medium-term forecasts all indicate that the ratio of the U.S. federal deficit and government debt to GDP will remain at a relatively high level in the next ten years or more, as shown in Figure 4. Since 2020, although the proportion of the federal budget to GDP has fallen from its historical high during the economic expansion period, it is still at the highest level since 1954 compared to other expansion periods.
• The Trump administration abandoned its initial austerity policy and instead continued the Biden administration’s fiscal expansion policies, such as large-scale tax cuts, and the sustainability of long-term debt has been repeatedly questioned by the market.
• The market generally expects that the United States is more likely to maintain debt sustainability through moderately high inflation and low real interest rates rather than through dramatic fiscal austerity.
For central banks and long-term institutions holding U.S. debt, this is equivalent to embedding a risk factor of “uncertainty in purchasing power and real returns” in the balance sheet. Therefore, it is necessary to hedge with gold and other non-local currency sovereign debt instruments in asset allocation.
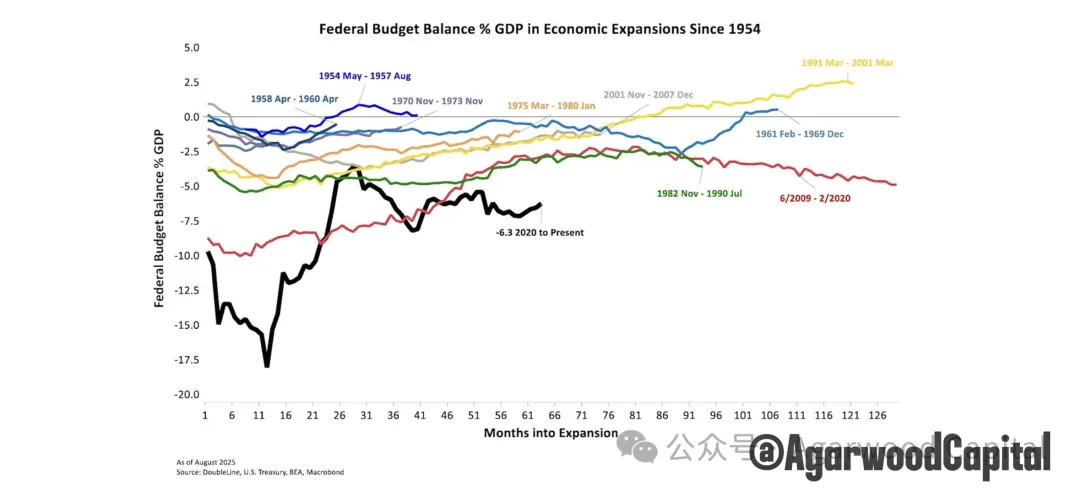
Figure 4: Federal Budget as a Percentage of GDP During Economic Expansion
Source: Double Lines
Central Bank Gold Purchases: The “Long-Term Foundation” of Structural Demand
This chapter brings the “why and how central banks buy gold” from a macro narrative to the data level, forming a quantitative sense of future demand.
3.1 Qualitative Change: Net Buyers for More Than a Decade
• Statistics from the World Gold Council show that since 2010, central banks have cumulatively net purchased more than 10,000 tons of gold. Central banks net purchased more than 1000 tons of gold for three consecutive years from 2022-2024, setting a historical record after the collapse of the Bretton Woods system, as shown in Figure 5.
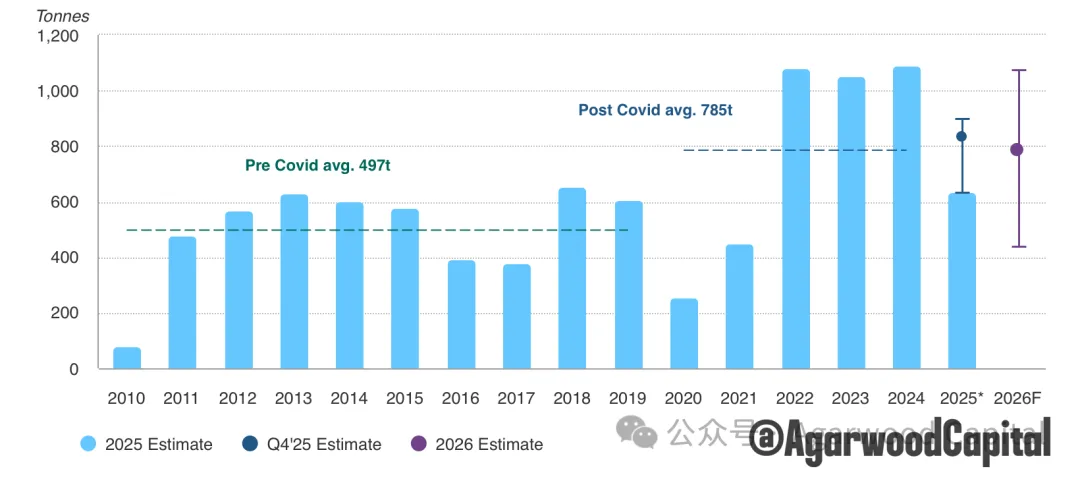
Figure 5: Total Annual Net Gold Purchases by Central Banks
This set of data illustrates:
• Central banks are no longer just marginal players in the gold market but are long-term structural buyers with low price sensitivity.
• This buying has raised the structural demand for gold to a completely new level, and the time scale is measured in decades.
3.2 Motivation: From “Historical Remnants” to “Sanction and Credit Insurance”
Since the sanctions on Russian reserves in 2022, the incremental share of emerging markets in central bank gold purchases has increased significantly and often appears during periods of heightened geopolitical tensions.
The motivation can be broken down into several levels:
• Sanction risk insurance: to avoid reserves being judicially frozen by opponents in extreme scenarios
• Diversification of foreign exchange reserves: reducing dependence on a single reserve currency and a single sovereign debt
• Payment and settlement backup: retaining a globally accepted collateral when some financial infrastructure is restricted from use
The manifestation of these factors in actual decision-making is that “the target proportion of gold in official reserves is being adjusted upward.” As long as this adjustment process has not been completed, central bank structural buying will still be in place.
3.3 Room for Central Bank Gold as a Percentage of Reserves
• Around 2010, global central bank gold reserves were approximately 26,000 tons; as of 2024, they have increased to approximately 32,000 tons, an increase of nearly 6,000 tons.
• The proportion of gold in the reserves of central banks in developed economies is generally between 20–70%, while it is approximately 5–10% in emerging markets and developing economies, as shown in Figure 6. If the latter’s goal is to gradually approach the former, the amount of gold required to achieve this goal in the next decade will still be considerable if the total amount of foreign exchange reserves remains stable.
• For example, the Polish central bank recently approved a plan to purchase up to 150 tons of gold, which will increase the central bank’s gold reserves to 700 tons. This will make Poland one of the top 10 countries with the largest gold reserves in the world. As of now, the Polish central bank can use 30% of its total reserve assets to purchase gold.
The significance for the next three to five years is that even if annual net gold purchases fall from 1,000 tons to 600–800 tons, as long as they are still significantly higher than the levels before 2010, the structural demand base for gold will continue to exist.
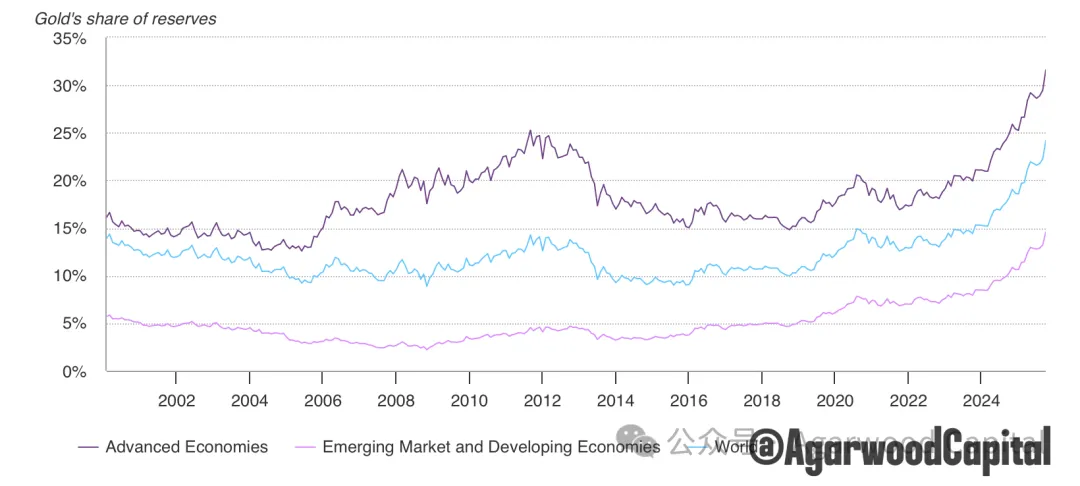
Figure 6: Gold Reserve Ratio in Developed and Emerging Markets
Source: Bloomberg, ICE Benchmark Administration, World Gold Council
Private Sector Demand and Interest Rates: “Acceleration” on Top of the Foundation
This chapter analyzes the impact of investment demand represented by ETFs and real interest rates on gold prices. Unlike the bull market from 2000-2011, gold spot ETFs are not the main force in this round of bull market, and the impact of real interest rates on gold prices is also weaker than historical levels.
4.1 ETFs and Investment Gold Bars: Reaction Layer of Interest Rates and Risk Preferences
• As shown in Figure 7, when gold prices rose in the first quarter of 2023-24, ETFs were still net outflows, and central bank buying dominated gold prices.
• ETFs began to have net inflows in the third quarter of 2024, catching up with the performance of gold prices, and with the formation of market expectations for interest rates to peak and future easing, they contributed greatly to the acceleration phase of gold prices. However, even if global ETF holdings increased by approximately 850 tons from May 2024 to November 25, it is less than half the level of the previous bull market cycle, meaning there is still a lot of room.
Figure 7: ETF Holdings Cycle Chart
Source: Bloomberg, ICE Benchmark Administration, World Gold Council, as of November 28, 2025
A clear positioning can be derived from here:
• Central banks determine the “structural bottom demand” for gold, while ETFs and investment gold bars determine the extent to which prices amplify the macro narrative.
4.2 Real Interest Rates: Opportunity Cost and Discount, Premium
Historically, as a non-interest-bearing asset, the level of real interest rates is the opportunity cost of holding gold. Therefore, there is a high negative correlation between gold and the 10-year TIPS real interest rate.
However, as can be seen from Figure 8, the gold bull market since October 2022 was completed precisely when real interest rates were high, highlighting the different core drivers of this round of bull market.
That is, in the context of central bank support, the impact of real interest rates on gold prices is as follows:
• When real interest rates rise and short-term inflation expectations fall, investors reduce their holdings of gold ETFs, and gold prices回调 to the central axis or lower edge in the structural bull channel.
• When real interest rates fall and the market expects to enter a low-interest rate or even negative real interest rate phase in the future, ETFs and leveraged funds return, and gold prices rise to the upper edge of the channel or even temporarily exceed it.
Therefore, in the perspective of three to five years, real interest rates are more suitable as a tool for judging “whether gold is in a discounted or premium state in the channel” and as an adjustment factor for wave rhythm.
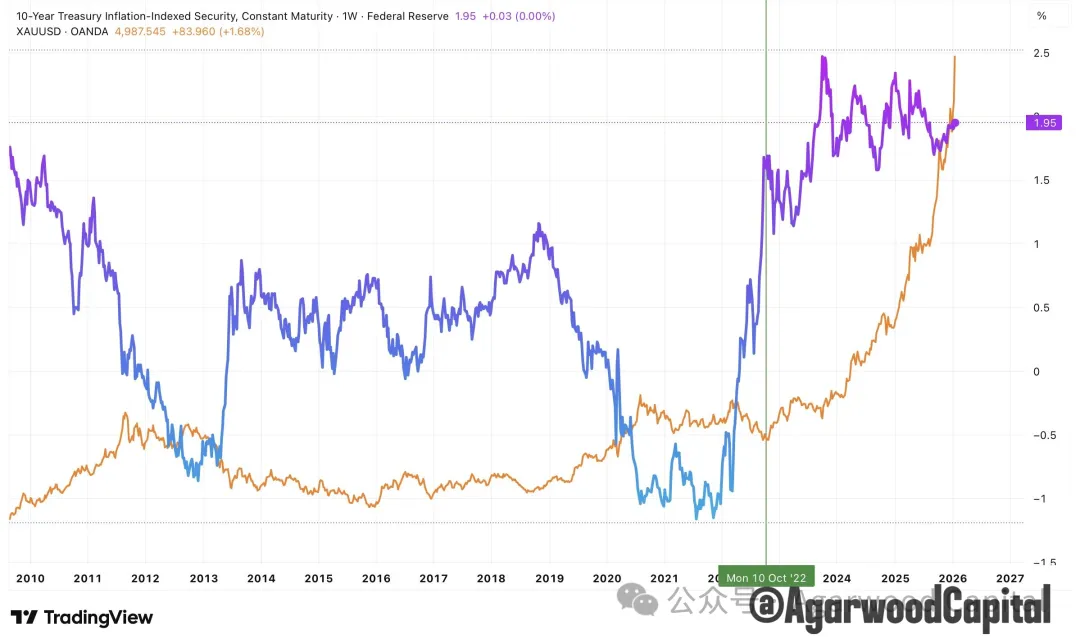
Figure 8: Comparison Chart of Gold Prices and TIPS Trends
Source: TradingView, Agarwood Capital
Supply Side: Mineral Supply, Recycling, and Cost Curve
Demand determines the long-term direction, and supply determines the long-term elasticity. The supply of gold mainly comes from minerals, which is very inelastic. Therefore, bull and bear cycles are measured in decades. The gold supply does not currently have an immediate “cliff-like shortage,” but it exhibits characteristics of “moderate growth, gradual plateauing,” and rising cost pressures, which still have an impact on the three- to five-year perspective.
5.1 Overall Supply: Historical High but Limited Growth
The World Gold Council’s 2024 report states:
• Global total gold supply in 2024 was approximately 4,974 tons, an increase of approximately 1% year-on-year, setting a new high since statistics began.
• Among them, mineral supply was approximately 3,660–3,670 tons, only a few tons higher than the previous high point in 2018, indicating that mineral production has basically been in a plateau area in recent years.
• Recycling supply increased by approximately 11% year-on-year in 2024, mainly reflecting the stimulation of high gold prices for old gold recycling, but it is still lower than the historical high in 2012.
• The World Gold Council expects that full-year mineral production in 2025 is expected to reach a new high, but the increase is relatively limited: it is expected to grow by 3% for the full year.
Overall, the supply is more like “moderate climbing + recycling elasticity,” and it is difficult to suppress prices through large-scale production increases.
5.2 Mineral Supply: Approaching the “Plateau Period”
According to data from the World Gold Council and other institutions, as shown in Figure 9, global mineral production has basically hovered around 3,600 tons in the last decade.
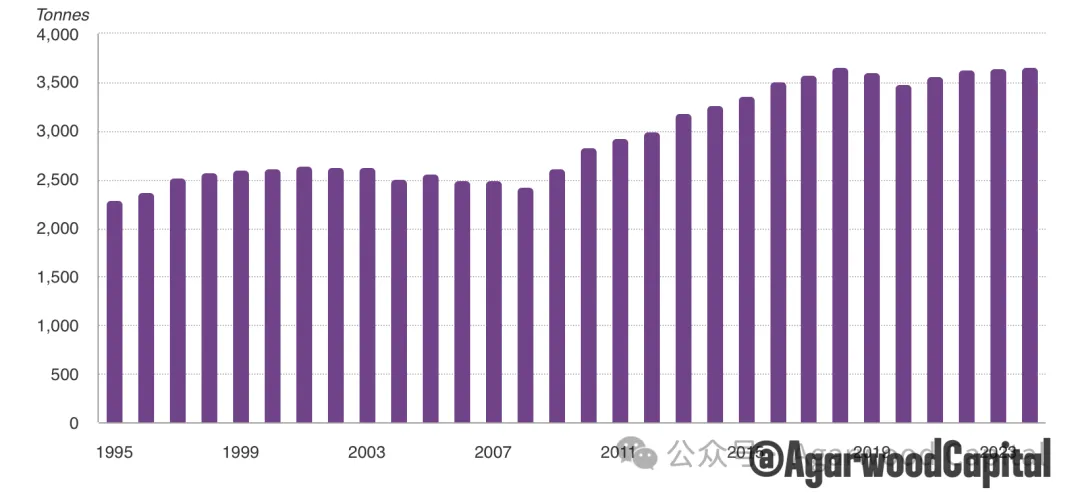
Figure 9: Schematic Diagram of Gold Mine Production
Source: Metals Focus, Refinitiv GFMS, World Gold Council; as of December 31, 2024
• After 2012, mining companies experienced a cycle of price declines and capital expenditure cuts, and exploration investment was significantly reduced. Even with recent price increases, the entire industry has limited results in new discoveries and large-scale projects.
This supply structure means:
• Even if high prices stimulate new projects, the cycle from exploration to production usually takes decades.
• Within a three- to five-year perspective, the buffering function of mineral supply against demand shocks is limited.
5.3 Recycling and Costs: Price Elasticity and Cost Bottom Line
• Recycling supply is more sensitive to gold prices. During the rapid price surge stage, old gold recycling will increase significantly, partially offsetting the increase in demand, but the reaction speed is still lagging and is greatly affected by culture and market structure.
• In terms of mining costs, the industry’s all-in sustaining costs (AISC) are trending upward in the long term due to factors such as energy, labor, environmental protection, and declining grades, which actually provides a gradually rising cost bottom line for gold prices.
Overall, the supply side provides a “relatively rigid supply curve” in the three- to five-year perspective. When the demand side is supported by central banks and order factors, price adjustments are mainly driven by demand and financial conditions.
Three- to Five-Year Scenario Analysis: Price Channel and Risk Distribution
Under the above demand and supply framework, three main scenarios can be constructed to think about the gold price path in the next three to five years.
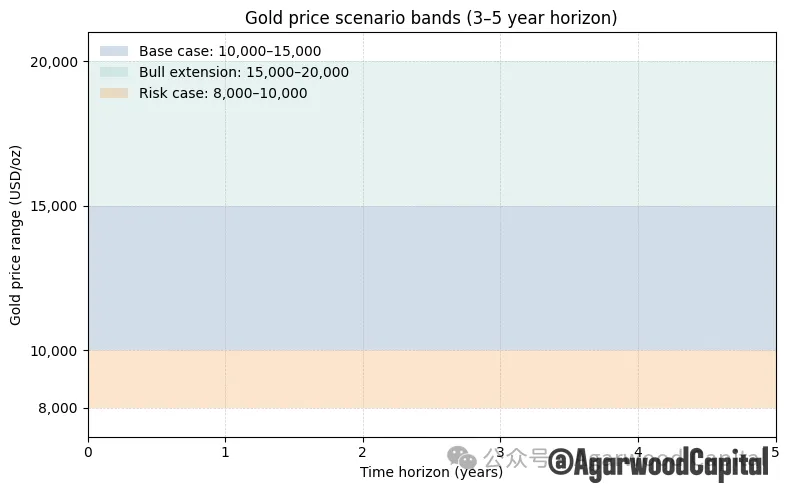
Figure 10: Scenario Hypothesis Diagram
Source: Agarwood Capital
6.1 Benchmark Scenario: Chronic Cracking of Order, Continuous Central Bank Purchases
Assumptions:
• The Trump administration continues to promote the deglobalization process, and various conflicts maintain high tension but are not completely out of control.
• Sanction tools and financial warfare tools continue to be used in local conflicts and negotiations.
• Emerging market central banks continue to increase their gold holdings at a rate of 600–1,000 tons per year, steadily increasing the proportion of gold in their reserves.
• Under fiscal pressure, the Federal Reserve and other major central banks find it difficult to maintain significantly positive real interest rates for a long time, and inflation fluctuates in the 2.5–3.5% range, or even higher.
In this scenario:
• The central axis of the structural price channel of gold is significantly raised, and the benchmark range can be set at $10,000–15,000.
6.2 Bullish Extension Scenario: Resonance of Currency and Order Crisis
More bullish tail-end scenarios may include:
• A major political or institutional event significantly weakens market confidence in the sustainability of U.S. debt or institutional stability.
• Major emerging markets and oil-producing countries accelerate the reduction of dollar assets and increase the proportion of gold and other physical assets.
• The Federal Reserve significantly eases monetary conditions when inflation is still high in order to cope with economic and asset market pressures, resulting in real interest rates falling into the negative range for a long time.
In this scenario:
• Central bank gold purchases continue to exceed 1,000 tons per year, and institutional and individual investment funds significantly increase their holdings through ETFs, over-the-counter, and mining stocks.
• Gold may test the $15,000–20,000 area in three to five years, interspersed with multiple sharp retracements of 20–30%.
6.3 Risk Scenario: Institutional Repair and Real Interest Rate Rebound
Bearish or correction scenarios need to meet relatively strict conditions:
• The Democratic Party regains control of both houses of Congress, forming an effective constraint on the Trump administration. The United States and major economies promote a certain degree of fiscal consolidation and institutional repair, and market concerns about long-term debt sustainability are eased.
• Inflation is successfully suppressed to around 2%.
• The marginal frequency of use of sanction tools decreases, and the issue of frozen reserves related to Russia and Ukraine is handled in some compromise.
• Emerging market central bank gold as a percentage of reserves is close to its target level.
In this scenario:
• The current risk premium of gold converges to a certain extent, and the price may reach the $8,000–10,000 range.
[Agarwood Capital]
Gold’s Rise and the Crypto Market: Implications for Digital Assets as Dollar Hedge
The recent analysis from Agarwood Capital presents a compelling case for gold as a primary hedge against the declining dollar-dominated order, with projections suggesting gold could reach $10,000-$15,000 in the next 3-5 years under a benchmark scenario, and potentially $15,000-$20,000 in more severe geopolitical and monetary conditions. This macro shift has profound implications for the crypto market, particularly for digital assets positioned as alternatives or complements to traditional safe-haven assets.
The Dollar Order Decline: A Tailwind for Crypto
The analysis identifies three primary drivers for gold’s structural bull market: the reassessment of the dollar order itself, central bank reserve reallocation, and institutional investment demand. Each of these factors creates favorable conditions for crypto adoption:
-
Sanction Risk and Diversification: The freezing of Russian reserves has demonstrated the political risks of holding dollar-denominated assets. This directly parallels the narrative for Bitcoin and other cryptocurrencies as censorship-resistant assets. Countries and institutions seeking to reduce geopolitical vulnerability may accelerate crypto adoption as a reserve diversification tool, particularly those under sanctions or at risk of being cut off from traditional financial systems.
-
Trust Erosion in US Institutions: The analysis highlights how Trump’s policies and chaotic domestic affairs have weakened the perception of the US as a reliable steward of the global financial system. This institutional distrust creates fertile ground for decentralized alternatives. As trust in traditional financial institutions erodes, the cryptographic guarantees and decentralized nature of blockchain systems become increasingly attractive.
-
Unsustainable US Finances: The unsustainable trajectory of US debt and deficits implies a long-term discount on the dollar’s purchasing power. Crypto assets, particularly those with fixed or predictable supply mechanisms (like Bitcoin), offer a hedge against currency debasement and inflation risks.
Central Bank Behavior: A Crypto Catalyst
The most significant insight from the gold analysis is the structural shift in central bank behavior. With central banks purchasing over 1,000 tons of gold annually for three consecutive years—levels not seen since the collapse of Bretton Woods—we’re witnessing a fundamental reassessment of reserve composition.
This behavior has direct parallels for crypto:
-
Strategic Accumulation: As central banks increase their gold allocation from historical lows (5-10% in emerging markets), they may similarly consider crypto assets as a strategic reserve component. The precedent of gold accumulation reduces the psychological barrier to including novel asset classes in official reserves.
-
De-Dollarization Trend: The shift away from dollar dominance is accelerating, and cryptocurrencies offer a viable alternative for international settlements and reserves. Countries seeking to reduce dollar exposure may turn to crypto or CBDCs as transitional solutions.
-
Institutional Legitimacy: The normalization of central banks as structural gold buyers legitimizes the concept of storing value outside traditional financial systems. This institutional acceptance framework can be applied to crypto assets as they mature.
Bitcoin as “Digital Gold”: A Strengthening Narrative
The gold analysis provides strong support for the “digital gold” narrative for Bitcoin:
-
Complementary Value Proposition: While gold serves as a physical hedge against dollar dominance and institutional risk, Bitcoin offers digital properties that gold cannot match: portability, divisibility, and programmability. In a world where both physical and digital assets are needed for diversification, Bitcoin and gold may serve complementary rather than competitive roles.
-
Supply Dynamics: Similar to gold’s plateauing mineral supply, Bitcoin has a predictable, diminishing supply curve. This shared characteristic of scarcity strengthens both assets’ value propositions as inflation hedges and stores of value.
-
Institutional Adoption Path: The same framework that has led central banks to accumulate gold—concerns about monetary policy credibility, sovereign risk, and portfolio diversification—could lead them to accumulate Bitcoin or other crypto assets in the future.
Market Implications and Opportunities
-
Correlation Shifts: As gold’s price drivers evolve away from traditional interest rate relationships, we may see changing correlations between gold and crypto assets. In periods of dollar weakness and geopolitical stress, both asset classes could move more closely together. During risk-on phases, crypto might outperform due to its higher beta nature.
-
Token-Specific Implications:
- Bitcoin: Most direct beneficiary as the primary “digital gold” narrative strengthens. Institutional flows toward gold could parallel those toward Bitcoin.
- Gold-Backed Tokens: May see increased demand as traditional gold holdings migrate to digital form, creating a bridge between traditional and crypto markets.
- Privacy Coins: Could benefit in scenarios of increased financial surveillance and sanctions, offering untraceable alternatives to both traditional banking and transparent blockchains.
-
Stablecoins: May see increased adoption as alternatives to dollar-dominated systems, particularly those pegged to baskets of assets including gold.
-
Regulatory Environment: The analysis suggests a multi-year trend of questioning dollar dominance. Regulatory responses could accelerate the development of crypto-friendly frameworks as governments seek to maintain influence in a multi-polar financial system. This could lead to clearer regulations for crypto as an asset class, particularly for institutional investors.
Risks and Considerations
-
Competition with Traditional Assets: The gold market’s structural shift could draw institutional capital away from crypto in the short term, as traditional asset managers become more comfortable with gold as an inflation and geopolitical hedge.
-
Central Bank CBDCs: Governments may accelerate CBDC development as a response to the decline of dollar dominance, creating state-sponsored digital alternatives to decentralized cryptocurrencies.
-
Market Volatility: The transition period could be marked by increased volatility as markets reassess relative valuations between gold, traditional assets, and crypto.
In conclusion, the structural bull case for gold presented in this analysis provides a powerful macro backdrop for the crypto market. The same forces driving gold’s reevaluation as a strategic asset—dollar dominance concerns, geopolitical risks, and institutional distrust—are equally relevant to crypto’s value proposition. While not a direct substitute, crypto assets, particularly Bitcoin, are well-positioned to benefit from this multi-year trend of reassessing the global financial order and seeking alternatives to traditional reserve assets.